


![]()
![]()
![]()
![]()
Page 11
VARIATION METRICS IN ECHO
UPCOMING ENTRIES:
2. MEASUREMENT OF SOCIOECONOMIC EQUITY
Abstract
Geographical variation in the utilisation of health care related to the socioeconomic status of area populations may be indicative of inequity. ECHO uses various approaches to illustrate and measure income-related inequalities in health care utilisation between administrative areas with different average income levels, as well as differences between high and low income areas over time.
The problem
Equal access to health care is considered a health policy objective in most countries. More precisely, a useful distinction can be made between ‘equality’ and ‘equity’. While the term ‘equality’ is based on a purely factual claim (e.g., whether two people receive the same amount of health care, ‘equity’ refers to a normative claim about fairness or social justice. The concept of equity used by ECHO is termed ‘horizontal equity’, which requires that equals be treated equally. This concept is usually formulated in terms of equal access or utilization of health care for a given health problem or need for care. Claims about horizontal equity must therefore consider how people’s circumstances, such as their age and sex, influence their need for care. Thus, it would be considered inequitable or unfair if persons with the same health care needs had different access or were treated differently.
Methodological alternatives
Various approaches can be used to measure income-related inequality, adjusting appropriately for need, in order to draw conclusions about horizontal inequity. The traditional approach is to generate a social gradient that runs from the poorest to the richest sections of the population, for example by dividing into deciles or quintiles based on income, and then calculating (standardized) utilisation rates for each of these groups. Another approach is to calculate summary measures of inequality, such as concentration indices, that make use of the full distribution of both health care and income, and illustrate results using concentration curves with income as a ranking criterion. These approaches use individual-based economic data.
The ECHO approach: analysing area-level social gradients
Not all countries have income data available at the individual level. ECHO overcomes this limitation by studying access to health care using area-level information. Following this orientation, messages on equitable access to health care shift from “access to a procedure depends on the patient income” (when using individual data) to “living in a high- or low-income area affects access to health care ” (when using area-level data).
Thus ECHO uses differences in utilisation (or admissions) between high- and low-income areas, allowing for age and sex differences in population structure, as an indication of potential inequity of access to health care. It is assumed that, after standardization of differences in age and sex, the level of ill-health and consequent need for health care is equally distributed across areas.
Methodology
The ECHO approach determines income-related differences by calculating and presenting geographical variation in health care utilisation by quintile groups of areas, ranked by average area income. Based on the area-level information available, countries are analysed using their respective meaningful units as follows: Denmark (98 areas; mean pop. 56,000), England (326 areas, mean pop. 159,000), Portugal (278 areas, mean pop. 36,000), Slovenia (12 areas, mean pop 169,000) and Spain (199 areas, mean pop. 234,000). Since the areas vary in population size, population-based quintile groups are used to ensure that approximately one fifth of the country’s population resides within each income group (see Table 1).
Various measures are calculated and displayed, including:
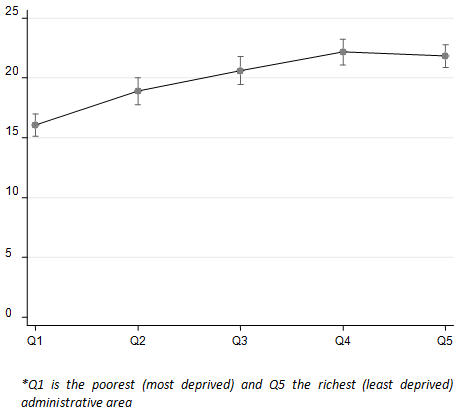
1) Graphs showing age-sex standardized utilization rate for a given year by quintile group (Figure 1);
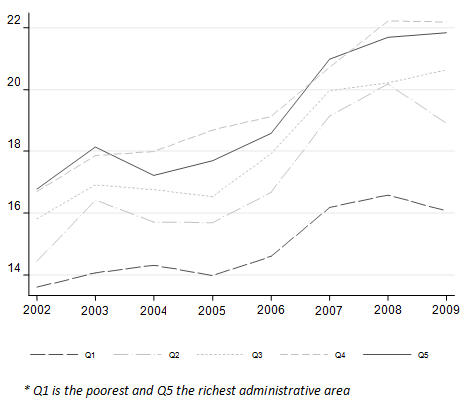
2) Graphs showing the evolution over time of standardized rates for each quintile group (Figure 2);
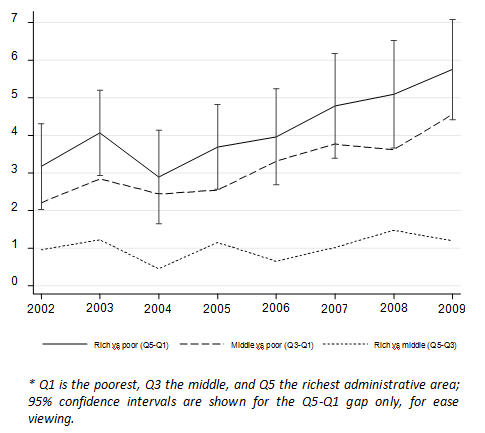
3) Graphs showing absolute inequality in standardized rates between extreme quintiles (Q1-Q5), with Q5 representing the richest group of areas, and between the intermediate group and each extreme (Q5-Q1 and Q5-Q3) (Figure 3);
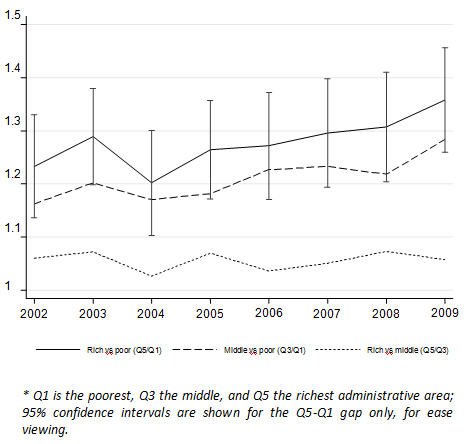
4) Graphs showing relative inequality ratios of standardized rates between extremes (Q5/Q1) and between the intermediate group and each extreme (Q3/Q1 and Q5/Q3) (Figure 4).
Case-study
The case of elective total hip replacements is described here to illustrate the type of information yielded by ECHO with regard to socioeconomic gradient and utilization rates. Specifically, this example concerns hip replacements in England from 2002 to 2009.
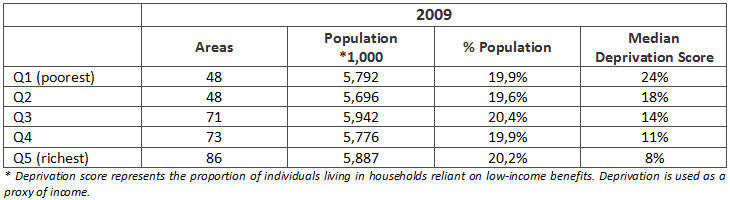
As observed in Table 1, health care areas are distributed in quintiles. In this case study, local authorities are distributed in socioeconomic quintiles, each containing between 48 and 86 areas, with a fairly homogenous distribution of the population living in each quintile (around 20% each).
Socioeconomic gradient is reported using the median value of the English deprivation score. This score represents the proportion of individuals living in households reliant on low-income benefits and is used as proxy of household income in an area.
Table1. Income quintiles groups of English administrative areas (Local Authorities), based on deprivation index (IMD 2007)
a) Differences across income quintiles: country inequality profile
Figure 1 depicts the country profile for the utilization of a specific procedure across socioeconomic quintiles. Confidence intervals provide insight into whether the differences are statistically significant or not. Figure 1 illustrates age- and sex-standardized utilisation rates of hip replacement per 10,000 population above the age of 35 for England in 2009. An increasing gradient can be seen from the lowest to the second highest income quintile, indicating an increase in utilisation with increasing average area income up to the 4th (second-richest) quintile. Some of these differences are statistically significant.
b) Socioeconomic evolution over time
ECHO also analyses changes over time by income quintile. For example, Figure 2 illustrates how the gap in age- and sex-standardized rates for hip replacement between the lower and higher income quintiles has widened slightly over time.
c) Absolute and relative differences
ECHO also provides insight on absolute and relative difference across quintiles and their evolution over time. ECHO takes three references, the difference between the richer and the poorer areas; between middle-income areas and poorest areas; and between the richest and the middle-income areas.
While the absolute difference provides a reference for the actual number of procedures performed in the richer areas as compared to the poorer (e.g., from 3 per 10,000 inhabitants in 2002 to almost 6 per 10,000 in 2009), the relative difference is expressed as follows: the richest areas show a 25% higher hip replacement rate than the poorest areas in 2002, which increases to a 35% gap in 2009. In order to understand the actual impact of this difference, it is advisable to take the absolute difference as reference.
Figure 3 illustrates the evolution of the absolute difference between the richest and the poorest areas, while Figure 4 illustrates the evolution of the relative difference. The graph also provides insight into whether the changes in this difference over time are statistically significant.
Figure 3 |
Figure 4 |
|
The summary conclusions of this case study are as follows:
• There is a socioeconomic gradient in the rates of hip replacement in England; exposure to hip replacement increases with socioeconomic level up to the 4th (second-richest) quintile. Statistically significant differences are observed between the two richest and the two poorest quintiles.
• Although differences between the highest and the lowest quintile appear to widen in the last two years studied, confidence intervals overlap year after year.
• These findings may indicate inequitable access, which remains constant over time, in the poorest areas, once needs-based differences (age and sex) have been ruled out. However, given the nature of this procedure (uncertain value in non-eligible patients), and the plateau observed in the gradient curve between the fourth and fifth quintiles, we cannot rule out overexposure in more affluent areas, where supply tends to concentrate.
Interpreting the socioeconomic gradient effect in ECHO
It is widely accepted that low-income areas tend to have worse health and greater health care needs than higher income areas. Thus, for example, low rates of hospital admissions after myocardial infarction in low-income areas would signal inequality of access. In general terms, that statement should be true when analysing effective, evidence-based services. However, this interpretation has to be nuanced when studying procedures of uncertain effectiveness in the non-average patient (e.g., knee replacement) or for which effectiveness has not been proven in the vast majority of patients (e.g., C-section in low-risk deliveries). These procedures are highly sensitive to clinical practice variation (signature phenomenon, learning cascades) and supply factors (organizational and financial incentives). Any difference across income quintiles in this kind of services should be interpreted merely as evidence of uneven exposure to uncertain or low-value care. Therefore, a rate difference favouring richer areas should not necessarily be interpreted as a symptom of access inequality in poorer areas, while higher exposure to low-value care in less affluent areas may be deemed inequitable.
While ideally one would like to measure socioeconomic inequality at the individual level, the use of area aggregated measures (as in ECHO) entails a mixture of both low- and high-income individuals. It is not the case that all individuals in a “high income” area are richer than all individuals in a “low income” area. This socioeconomic heterogeneity within areas means that area level analysis will likely not be a good proxy of the ”true” individual-level socioeconomic gradient; it will capture “between area” inequality, but will not pick up on “within-area” inequality between individuals. Thus, interpretations cannot be made in terms of inequalities between “rich” and “poor” individuals, but rather in terms of differences between richer and poorer areas.
Lastly, as an ecological variable, average income will correlate with other variables at the ecological level. For example, high average income could also mean a higher density of hospital providers (public and private), more variety (a larger network of alternative providers), or even shorter distances to a hospital service. In other words, when interpreting high vs low area-level income, factors other than income could actually account for the differences observed across quintiles.
KEY POINTS
• Most previous cross-country comparisons of socioeconomic equity in health care utilisation have used individual-level survey data on the utilisation of general forms of health care used by a substantial proportion of the general population, such as physician visits. The ECHO approach allows us to paint a more detailed picture by examining equity in the utilisation of more specific forms of health care (namely specific procedures or clinical conditions) used by a small proportion of the general population, such as hip replacement;
• The ECHO approach can also shed light on the evolution of those differences across socioeconomic quintiles, over the years.
• Since ECHO uses an ecological approach (area-level data), the research question addressed is “whether living in a high- or low-income area affects access to health care”.
APPENDIX:Coding of Hip Replacement
Please cite this publication as:
European Collaboration for Healthcare Optimization (ECHO) www.echo-health.eu. Zaragoza (Spain): Instituto Aragonés de Ciencias de la Salud - Instituto Investigación Sanitaria Aragón; c2011. Christiansen T, Cookson R, Gutacker N, García-Armesto S, Angulo-Pueyo E, Bernal-Delgado E on behalf of the ECHO consortium. Handbook on methodology: Measurement of socioeconomic equity; 2014 Apr 27 [ accessed: date ]; Available from: http://www.echo-health.eu/ handbook/ measuring_inequalities.html
![]()
![]()
![]()
![]()
Page 11